Key Takeaways
- Hidden bottlenecks often lurk in code inefficiencies, unoptimized databases, or resource constraints.
- Combining profiling, real-time monitoring, load testing, and code review uncovers and prevents performance issues.
- Integrating regular analysis and optimization into the development lifecycle leads to more reliable, scalable applications.
Introduction
Ensuring your application delivers a seamless and responsive user experience despite complexity and growth is a formidable challenge. Even a high-performing application can develop performance impediments that remain invisible until they start affecting users. Hidden bottlenecks—subtle, obscured slowdowns—can compromise your business’s reputation, undermine revenue, and frustrate end-users. Leveraging intelligent eG Innovations solutions can help bring these issues to light, enabling teams to identify and address inefficiencies before they escalate.
Identifying, pinpointing, and resolving these hidden performance anomalies requires robust monitoring, intelligent analytics, and strategic review. It’s about going beyond surface-level metrics to diagnose the core causes of slowness, database lags, and code inefficiencies. By systematically tackling bottlenecks, teams can maintain optimal performance, ensuring that applications remain agile and dependable at scale.
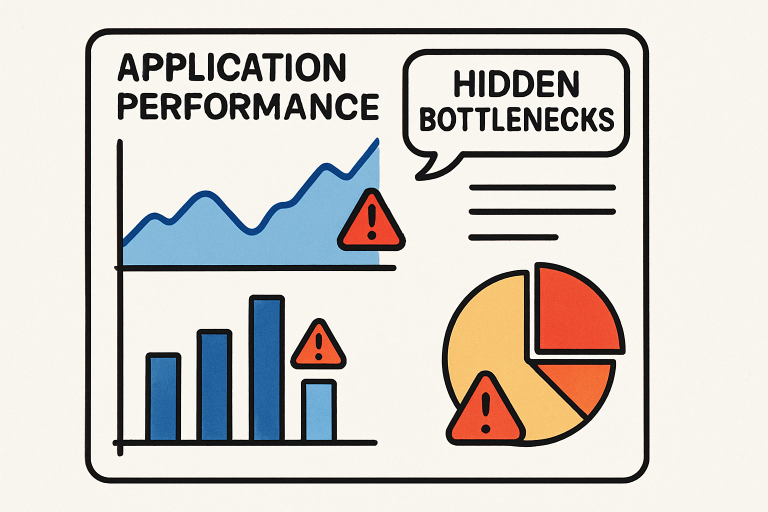
Understanding Hidden Bottlenecks
Hidden bottlenecks are covert performance issues that evade standard testing and benchmarking. They tend to arise from routine development oversights—such as database queries lacking indexes, inefficient algorithms in core business logic, or misallocated compute resources within server clusters. Because these inefficiencies aren’t always obvious, they may only appear under certain user conditions, higher loads, or specific request patterns. For example, a join operation in a database may function smoothly under light traffic but severely degrade response times during peak usage, dramatically affecting user satisfaction and conversion rates.
Utilizing Profiling Tools
Profiling tools spotlight trouble spots within an application, revealing which workflows and methods consume the most CPU cycles or memory resources. Developers and operations teams commonly rely on tools like VisualVM, PyCharm Profiler, and Chrome DevTools to analyze code execution paths and detect issues such as memory leaks, object retention, and expensive loops. These deep-dive analytics provide visibility into function call hierarchies and timeline breakdowns, allowing for precision tuning and pinpoint refactoring to resolve hidden inefficiencies.
Implementing Continuous Monitoring
Continuous monitoring is fundamental in identifying real-time performance drifts and resource pressures. Modern application monitoring platforms like New Relic and Dynatrace offer automated anomaly detection, alerting, and root cause analysis. Organizations can reduce downtime by proactively capturing and visualizing logs, metrics, and traces from across the stack, as highlighted by a recent Gartner report detailing how effective monitoring reduces outages and improves user satisfaction. These platforms also enable proactive trend analysis—catching emerging issues before they escalate into widespread incidents.
Conducting Load Testing
Load testing is a systematic approach to understanding your application’s behavior under variable user activity. Tools such as Apache JMeter and k6 simulate concurrent usage scenarios, mimicking thousands of users to expose weaknesses that only become apparent when infrastructure is stressed. Through load testing, engineering teams can measure error rates, transaction response times, and resource utilization, allowing them to triage and remediate weaknesses in both code and infrastructure before production release. Effective load testing is imperative for maintaining reliability during launches and traffic spikes, as demonstrated by case studies featured on TechCrunch.
Optimizing Database Queries
For many applications, inefficient database operations are a significant source of hidden lag. Profiling tools like MySQL’s EXPLAIN and PostgreSQL’s ANALYZE Empower engineers to inspect query plans, revealing where full scans or costly joins occur. Rectifying slow queries often involves adding proper indexes, rewriting queries for efficiency, or refactoring the database schema. Regularly monitoring slow query logs and query performance dashboards is vital; unoptimized data access can quietly sap performance, particularly as data volumes and concurrency increase. For comprehensive guidance, the InfoQ database optimization section provides in-depth articles and best practices for various RDBMS platforms.
Regular Code Reviews
Instituting routine code reviews is a proven practice that significantly minimizes the likelihood of performance regressions reaching production. By having peers evaluate one another’s work or engaging in pair programming, teams focus on enhancing code readability, maintainability, and overall efficiency. This process ensures that potential issues are identified before they escalate, leading to stronger and more reliable software. A McKinsey report highlights that peer review integration can lower defect rates by up to 30%, reflecting its impact on quality and productivity. Beyond human collaboration, combining automated analysis tools with manual review adds another critical layer of quality control. This hybrid approach allows teams to detect subtle inefficiencies, structural weaknesses, or glaring errors early, fostering a culture of accountability and excellence.
Leveraging Real User Monitoring (RUM)
Unlike synthetic testing, which simulates traffic under controlled conditions, Real User Monitoring (RUM) captures users’ experiences across browsers, device types, and geographic locations. This real-world perspective provides invaluable insights into how different environments affect performance. Using tools like Google Lighthouse and Pingdom, teams can monitor metrics like Time to First Byte, Largest Contentful Paint, and other vital performance indicators directly impacting user satisfaction. By focusing on what genuine users encounter in production, teams can prioritize fixes that drive the most significant improvements. This approach ensures optimization efforts lead to measurable results and complements synthetic testing and other monitoring strategies, creating a more complete understanding of performance aligned with user experience goals.
Conclusion
Hidden application bottlenecks often remain undetected, even by highly skilled teams, until users experience slowdowns, glitches, or disruptions that compromise satisfaction and trust. These issues can stem from inefficient code, poorly configured infrastructure, or unexpected spikes in demand. A multifaceted approach is essential for addressing such risks effectively. By integrating advanced profiling techniques, organizations can pinpoint inefficiencies at the code level, while automated monitoring tools provide real-time visibility into application health. Continuous load testing exposes weaknesses under stress, ensuring preparedness for peak usage, and rigorous code reviews help prevent recurring issues. Together, these strategies establish a proactive defense against performance threats. Prioritizing systemic performance health protects user experience and business outcomes and ensures scalability, resilience, and adaptability, empowering applications to meet evolving demands and thrive in dynamic environments.